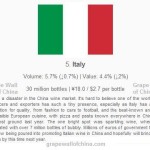
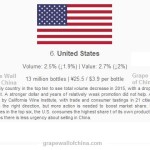
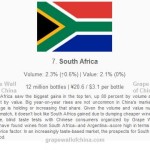
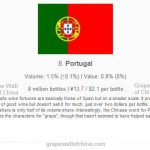
China Customs released its wine import stats for 2015 and intriguing stories lie behind those numbers, from the continued resilience of France to the successes of Australia and South Africa to the continuing disaster that is Italy.
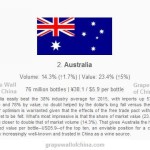
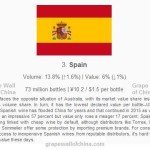
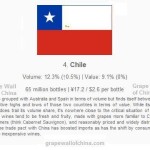
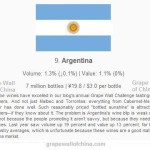
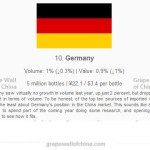
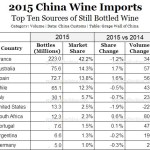
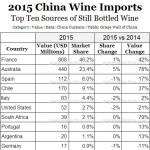
The most recent Grape Wall newsletter — it’s free: subscribe here — covered the top ten nations, including number of bottles, price per bottle, market share by volume and value, and personal comments. I’ve taken that info, added flags–fancy!–and made this gallery. I also added a few tables, one for volume and one for value.
Creating this post and others is a lot of work. Much appreciated if you spread the word about this site or, if it has helped your business, help cover its costs. And thanks to those who help make Grape Wall possible, such as MLP, who provided the import data.

Check out the new online China Wine Directory. And if you’d like to get the free Grape Wall e-newsletter, sign up below.
(Get the free Grape Wall newsletter here. Follow on LinkedIn, Instagram, Facebook and Twitter. Grape Wall has no sponsors: help support the mission, including World Marselan Day via PayPal, WeChat or Alipay. Contact Grape Wall at grapewallofchina (at) gmail.com.)
Leave a Reply
You must be logged in to post a comment.